Improving Home-Blood Pressure Monitor Experience
User Experience Research
Discovering hidden issues and potential ideas through understanding the experience and the needs of the Blood Pressure community through a User-Centered approach.
Background
Currently, many patients express concerns regarding interpreting their results, the reliability of equipment, and a lack of knowledge about how to use the equipment. When at-home blood pressure monitoring results are not understood correctly, home blood pressure monitoring confuses patients who struggle to operate the equipment. This increases the frequency of unnecessary emergency room visits.
To understand the root issues and develop ideas for the solutions, we held three co-design sessions with physicians and registered nurses from Sunnybrook Hospital;
1. Journey Map Co-Creation
2. Brainstorming Ideas
3. Feedback Session and Prototype Co-Creation
Several interviews with patients were also conducted to understand their experience using the Home Blood Pressure Monitor. The following design solutions were chosen; Library Hub (Service design), Storytelling poster/ brochure (Graphic design), Home Blood Pressure Monitor App (UI/ UX Design).
First Co-Design Session – Journey Map
The journey map describes the journey of patients who go through the high blood pressure treatment; from primary care appointment, diagnosis of high blood pressure, home blood pressure monitoring, blood pressure management, primary care follow-up, and specialist appointment, to responding to a bad number on home blood pressure monitor. The map also outlines what patients feel and experience – what works well and also the challenges that they encountered during each stage of their treatment.


Patients Interview
“I Prefer a simple design, just give me one button to start and stop.”
“I don’t want my wife to help me…When she helps me, she will see the numbers fluctuate on the screen and it makes me nervous to see her expression. It makes the result higher than usual.”
“It’s not easy to put the cuff on my arm.”
User Personas
Jacob (Patient)
Father of three with multiple risk factors; Jacob is inclined to ignore his symptoms; he doesn’t want his family to worry.
“I find it difficult to open up about my psychological pain.”
Kael (Provider)
A nurse practitioner in a busy nephrology clinic. She provides a lot of education for patients who are starting to manage their blood pressure as part of their care plan.
“I think HBPM is very good for patients to participate in, but I would not recommend it for those who are very anxious”
Ethel (Patient)
An elderly widow with chronic illness and co-morbidities; Ethel’s daily routine includes managing her diabetes and chronic kidney disease.
“It’s a lot to manage and sometimes I forget to take my blood pressure. I do not want my home to look like a clinic with all this equipment.”
Sheldon (Provider)
A Physician who specializes in hypertension and chronic kidney disease: Sheldon would like to see an increase in strategies to help patients meet their targets and lower their health risks.
“Consistency and standard resources would improve patient education and self-monitoring.”
Second Co-Design Session – Brainstorming Ideas
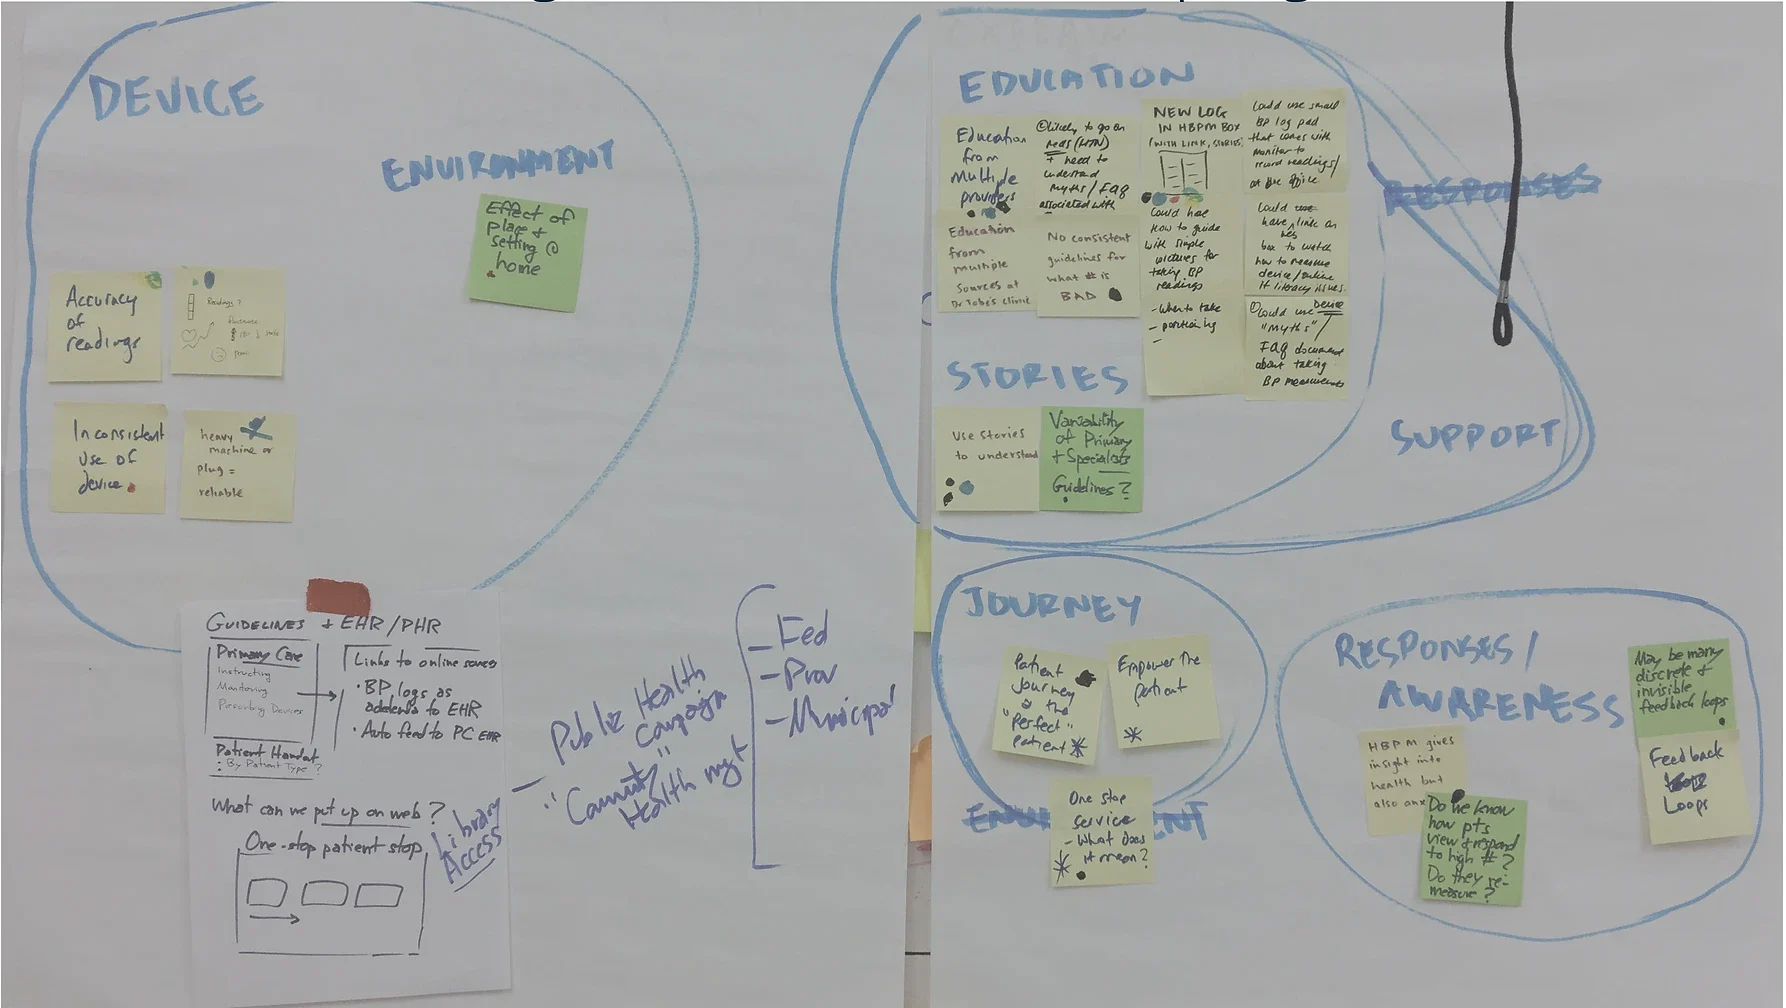
In the second co-creation session, we brainstormed with the clinicians from Sunnybrook Hospital to generate some ideas. The team selected a few ideas for the next design development. Using a user-centered design approach, the chosen ideas were developed further by the team.


Potential Design Solutions
UI/ UX Design
The UI/ UX design solution was developed using an evidence-based, user-centered approach (through ethnography research and interview sessions with patients and healthcare providers). The team proposed a UI/ UX home blood pressure monitor mobile app that can be synced via Bluetooth with your HBPM device (instead of using the HBPM device screen).
Graphic Design
Based on the interview with Dr. Tobe Sheldon (Sunnybrook Hospital), storytelling is a powerful method to make patients understand their blood pressure treatment, reduce their anxiety when they are doing their blood pressure measurement, and how to take their blood pressure measurement properly.
Using a graphic visualization approach, the team created a poster storyboard that tells several stories related to blood pressure. For example, how to prepare yourself before taking a BP measurement, what to do if you get a bad result, and how to reduce nervousness when patients are measuring their BP).
Service Design
The service design approach is to make a library hub related to blood pressure information.
The idea is to give knowledge to the public especially patients with high blood pressure. At the library hub, they can educate themselves through brochures, videos, and graphic posters related to blood pressure treatment. Overall the goal of this service is to empower patients to understand their illness, but also in hopefully reducing the incidence of high blood pressure and, alternatively, reduce unnecessary ER visits.